
Oracle Performance – SQL Performance Diagnostics.
SQL Diagnostic Reporting: Out with SQLHC, In with DBMS_SQLDIAG.REPORT_SQL
Have you ever needed to produce a comprehensive, easy-to-read diagnostic report for a specific SQL statement while troubleshooting poor performance? Before 26ai, you most likely reached for the SQL Tuning Health Check, better known as SQLHC.
In 26ai, a new function has been added to the DBMS_SQLDIAG package. This function is REPORT_SQL, and it comes built into the database. No need to download anything, it is very easy to use, and the report it produces gives very useful information. Even though SQLHC is quite easy to use, it is an external SQL diagnostic tool maintained by Oracle Support and therefore has to be downloaded from My Oracle Support and uploaded to your database server. So if one lacks a valid Oracle Support account, SQLHC cannot be used, not even for evaluation purposes. Installing Oracle 26ai Free will give us this new function, and we can therefore evaluate it without having to download anything from My Oracle Support.REPORT_SQL can be used to generate highly informative, human-readable reports containing in-depth performance information about the specific SQL statement you want to investigate. It has also been backported to 19c (RU 19.28), which is great if you have not yet been given the opportunity to upgrade. As mentioned, REPORT_SQL is built into the database and, as per my understanding, serves as the successor to SQLHC. It gives the user a deep-level diagnostic report for a specific SQL statement. REPORT_SQL produces one single HTML report containing all the information, compared to SQLHC, which produces many output files. With REPORT_SQL, we have everything in one place. The report consolidates relevant optimizer information, configuration parameters, statistics, execution plans, and much more, all in one location. Really smooth, I would say.
REPORT_SQL Content:
– Execution Plan Information
– Plan History
– Information about involved tables (table statistics, column information, etc.)
– Index information (statistics, indexed column information, etc.)
– Relevant instance parameters.
– Plan control parameters
– ASH information (when available)
– Bind information
– And much more
Working with DBMS_SQLDIAG.REPORT_SQL Report:
Using the REPORT_SQL function is very easy. In its simplest form, all we need is the SQL_ID at hand.
Example:
set feedback on
var report clob;
exec :report := dbms_sqldiag.report_sql('<SQL ID>');
We can view the report by spooling the content to a file:
set trimspool on
set trim on
set pagesize 0
set linesize 32767
set long 1000000
set longchunksize 1000000

spool report_sql_diagnostics.html
select :report report from dual;
spool off
There is another way of using the function, and this is the one I prefer. This approach requires a DBA_DIRECTORY where the report will be created.
We also need the SQL_ID and a decision on how much information we want the report to contain.
There are three levels available, and they determine the depth of the information provided.
Levels of information:
BASIC: A minimal report containing only basic sections, the bare minimum.
TYPICAL: Contains more information, both basic and advanced sections. This is the default.
ALL: The most comprehensive report, covering all details possible.
For demonstration purposes I’m using Oracle Database 26ai Free — no account required, just download and run. I’m connecting through SQL Developer and Linux. If you want to follow along, the Free edition covers everything demonstrated here. Production or commercial use is a different story — make sure you’re properly licensed.
As I prefer the second way of using this function where we can specify the output directory and the level of information provided in the report, a directory needs to be created both on the filesystem and in the database.


Now let us create a report for a specific SQL_ID. We will use the ALL level and send it to the DBA directory named SQLDIAG_REPORTING that we just created.
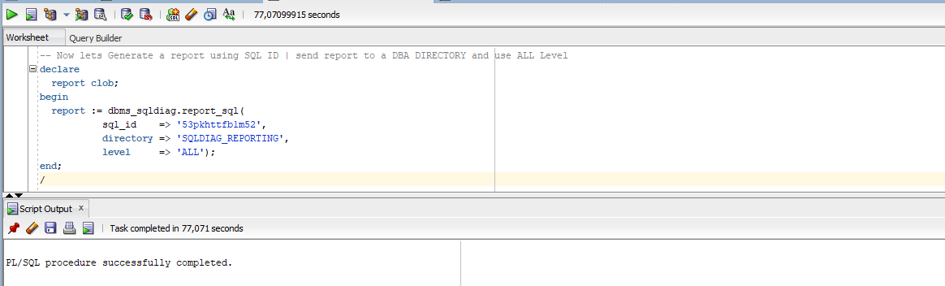
Time to verify the report has been created. As can be seen below, a compressed file has been created.

If we unzip the file, one HTML report is extracted. We then transfer the HTML report to our laptop so we can view it.

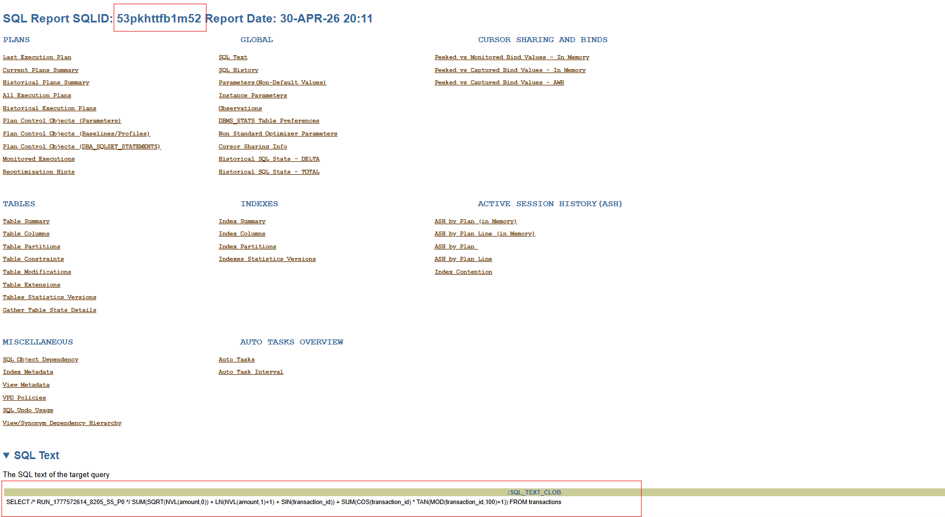
Below is some example output from the report. We can first see all the sections that can be generated, when the report was created, for which SQL_ID, and the SQL text.
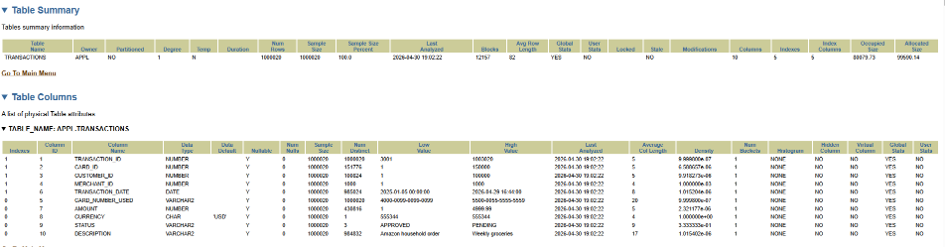
Below we can see which table was involved in the query, along with statistics such as the number of rows, when the table was last analyzed, how many columns it has, and how many indexes are defined on it.
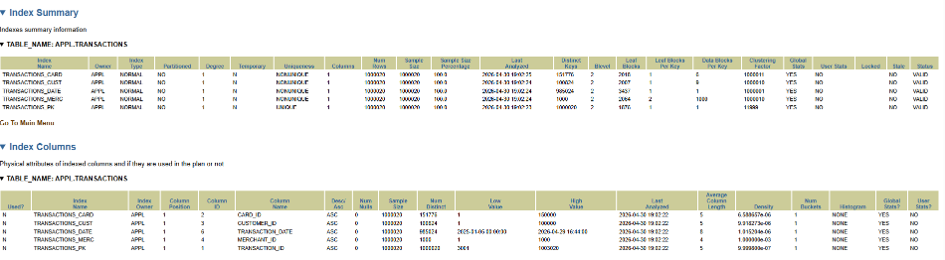
We get a lot of consolidated information about the indexes on the table, which would take quite a bit longer to collect ourselves than using the report.
We also get the execution plan for the specific query, which is very useful to have alongside the rest of the information in the same report.
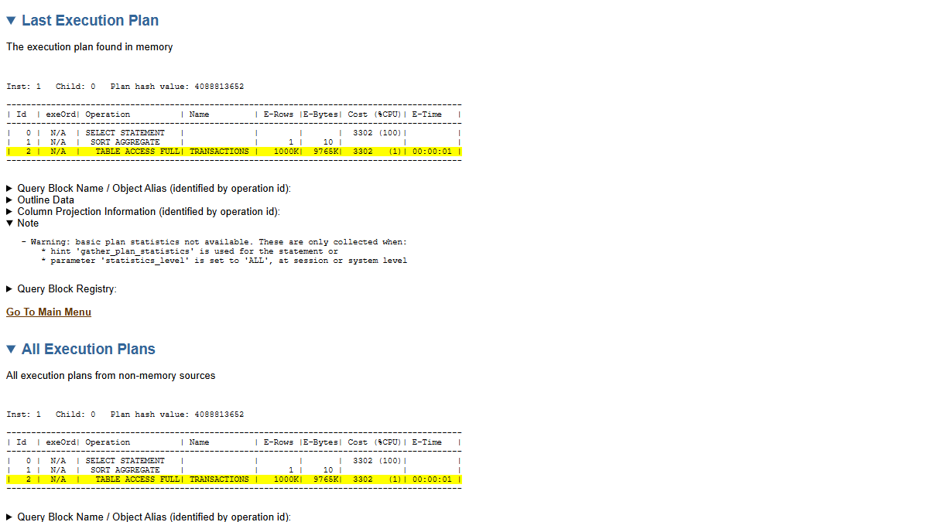
For this specific query, we can see that none of the indexes are used. The query was created specifically to put a lot of pressure on the CPU and was running concurrently 20 times.
DBMS_SQLDIAG.REPORT_SQL can run on all editions of Oracle Database, both on-premises and in the cloud, with no Enterprise Edition requirement. See https://blogs.oracle.com/coretec/diagnose-sql-performance-with-dbmssqldiag for more information.
The function itself does not require Diagnostics or Tuning Pack licensing. However, it is worth noting that the report may include content sourced from AWR or ASH, and consumption of that data is what normally triggers Diagnostics Pack licensing. I have not been able to find anything in the Oracle documentation that explicitly clarifies this point for REPORT_SQL, so if in doubt, please verify.
There is more output to read and analyze in the report, but hopefully this post will lead you to try out this great new function on your own.